9 minute read
 Test and Measurement
Blackmagic's cameras are bringing a raw workflow to an uprecedented number of people, and also highllighting the difference between raw and "standard" ("Rec 709) video - the stuff we've been used to up to now. If it seems complicated, it will be a little bit less so once you've read Phil Rhodes' article.
This article may be best appreciated having already read our Previous Article on Test and Measurement
The last time we looked at test and measurement options, we went into the background of the various test equipment features that exist in modern monitors and software and how they often relate to historic devices. In this article, I'm going to look at how some of those options – particularly waveform monitoring – apply to camerawork with some real-world examples of how waveform displays relate to the pictures they're analysing, and how that can be useful to us.
This article was in preparation at the same time that I had the Blackmagic cinema camera on review, and all of the test shots in this article were taken using it. It's an interesting camera from an exposure and luminance-handling point of view because it allows us to shoot in either log or Rec. 709 colorimetry, ideas which will be familiar to readers of my article on luminance encoding.
The other major piece of technology I used while putting this piece together is the Resolve software. I'm intending to do another write-up on monitoring in post-production, but it was a good way to read the camera's raw files with Blackmagic's preferred processing, as well as a quick way to produce some of the images on this page. Images in this article described as “log” are in the luminance encoding that Blackmagic call “BMD Film”, which is described in the camera's manual as a logarithmic encoding (though with the usual reservations about companies quite reasonably using curves that make the camera work best, as opposed to any particular mathematical algorithm). Images described as “709” are processed from BMD Film using the lookup table (LUT) that Resolve calls “Blackmagic Cinema Camera Film to Rec709”, in the “3D Display Lookup Table” settings dialogue. My intention is not to specifically recommend or endorse any particular LUT or workflow, as there are many reasonable approaches and a lot of good LUT options available. I used these settings because they're a good attempt at a standard, unadulterated configuration. My impression is that the 709 LUT used in this setup is quite harsh, but that's 709 for you, and I'm happy that the results we see here are representative of current practice.
Charts were illuminated under high-CRI fluorescent light, the side-effects of which are slightly visible in the lack of saturation in the red and magenta patches and the fractionally excessive saturation in green and cyan. This is not intended to be a camera test; these deviations are reasonable under the circumstances and they won't affect our observations.
One of the first and most enlightening things we can do with these devices is to actually have a look at some pictures and see what we get by way of waveform images that represent them.
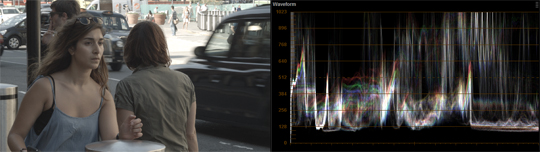
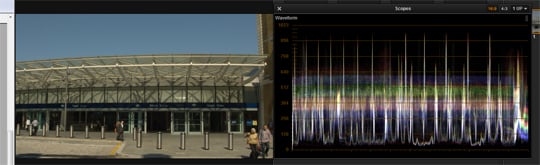
For a quick refresher on the idea of waveform monitoring, let's look at this still:
We're viewing a log image in sRGB here, so the contrast and saturation is muted. However, we can clearly see a series of peaks on the waveform display that relate to the bright specular reflections on the metal posts in the image. We can also the sky represented in the coloured band between values 384 and 512 (this being a 10-bit, zero to 1024 waveform). The Resolve waveform display is quite nice in that it draws the red, green and blue components in their respective colours, so we can see that the sky is tinted blue by the fact that the blue layer of the waveform display is uppermost, indicating the greatest energy is in blue. This would be more pronounced in Rec. 709, with its greater saturation.
Now, assuming we had a waveform monitor on set, one of the most basic things we could do with it would be to check exposure. The classic Macbeth chart (now strictly speaking called an X-Rite Color Checker) is actually not a terrifically good reference for most types of monitoring, as the large number of colour patches create a rather confusing display. They're really intended for certain types of monitor and camera calibration using special software, although they're still a well-known eyeball reference. Anyway, the individual columns of coloured blocks are clearly visible on the waveform monitor and we can see the saturated colours producing red, green and blue fields at various intensities.
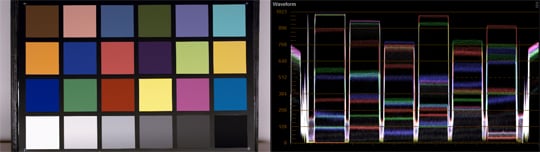
Most critically, we can see that almost the entire 0-1023 luminance range is filled with information, although no part of the chart is overexposed and thus clipped. The tallest peak at the left hand side of the display is motivated by the white block at the lower left of the chart, and it is placed almost but not quite at the 1023 level. Sitting in relaxed comfort looking at these images, it's pretty clear that the white block is at or near the maximum brightness that our displays can reproduce.
But what if this weren't so?
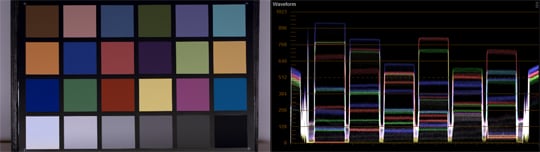
Now, since you're looking at that image surrounded by a white website backdrop, it's easy to tell that the white block is no longer as white as it might be. On a film set, perhaps outside in bright sunlight where it's hard to see the monitor, or indoors or at night with bright lights shining in our eyes, it can be alarmingly difficult to tell just by looking at a monitor that underexposure is making highlights look dull. However, by glancing at the waveform, we can easily see that the white block is not at 100% luminance; it's at about level 768, maybe half a stop, or perhaps a full stop, underexposed. With more knowledge of how the Rec. 709 lookup table works, we could tell precisely. Such an image might be recoverable, and in many situations we might even choose to shoot with a slightly less pronounced degree of underexposure, in order to retain detail in even more brightly illuminated areas. With a waveform monitor, we can do so consistently and with confidence that we know what we're getting. Or, just possibly, quake with fear at the level of underexposure that our lighting package is imposing upon us.
For this simple reason, if no other, a waveform monitor is a crucial accessory to the digital cinematographer. It's the modern equivalent of a light meter, whether you choose to use one of those as well or not.
Both of the exposure test images above are in Rec 709 colorimetry. This situation becomes a bit more complicated when we're using other luminance encoding techniques. Before we dive into the subject, let's have a quick look at exactly why we might want to do that.
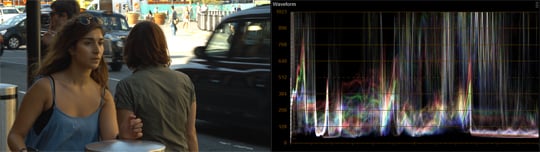
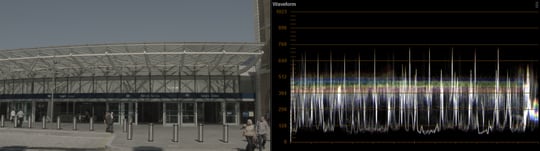
This image is part of a sequence that was shot outdoors in bright sunshine, and although the subject is in shadow, part of the background is in full sunlight and is overexposed. We can confirm this suspicion by noting that the overexposed area is on the right-hand side of frame, and verifying that the right hand side of the waveform has a pronounced flattened area at the top, indicating clipping.
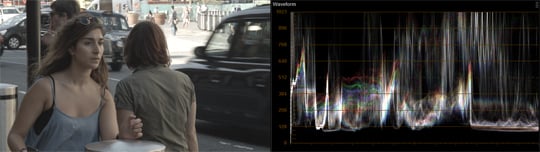
This is the same image, viewed with what Resolve refers to as “No LUT”. Exactly what this means in a precise and technical sense can be complicated, and is highly dependent on the internal implementation details of the Resolve software itself. For the purposes of this discussion, however, it's sufficient that we know that it is being displayed without any intention of changing the luminance or colorimetry to match the behaviour of the display. For the sake of full transparency, I should make it clear that Resolve decodes BMD Film images to a considerably reduced luminance range by default and I have not applied a simple unity-gain grade to normalise this; this does not affect the discussion other than by making the waveform images easier to compare.
The result of viewing unprocessed log is that the image appears greyish and washed-out, as we are viewing a log image on a computer monitor, which is an sRGB display. What's most noticeable is that the previously overexposed area now contains much more information and is not clipped in such an ugly fashion. Examining the waveform, we see that there is still clipping, as the brightest areas of the image are absolutely outside the range of the camera's sensor and can't ever be recovered, but the material is much easier to work with. Strictly speaking, much of the same information is actually still there in the 709 version, but crammed almost invisibly into the brightest few digital luminance values. Even though grading can recover, or perhaps just prettify, some lost highlight detail into the Rec. 709 version, it's clearly not a great starting point for colour correction.
This, then, is why we pursue log, or alternatively high bit depth linear light which is then turned into log, in recording systems. Not only because, as we saw in the last article, because they make better use of bit space, but also but simply because they don't deliberately throw information away.
Test and measurement for different luminance encodings
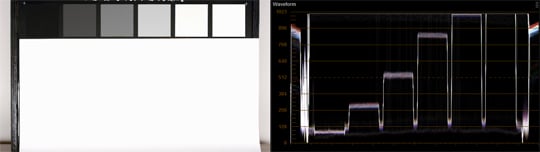
Readers who've read my previous article on luminance encoding techniques will recognise this situation. With logarithmic luminance encoding, we use about the same amount of digital values for every stop. If we mask off the coloured blocks on the chart and just look at the greyscale, we get this:
Now, I hasten to make it clear that this is not intended to be a dynamic range test. The Blackmagic Cinema Camera is capable of far more dynamic range than can be realistically assessed using a simple non-backlit chart and the expanse of white paper causes a lot of glow and flare which would affect results in the darkest patch. Anyway, this test is more than good enough to show that, on the waveform display, we see each of the blocks clearly, separated by the dark lines of the chart background, and that the difference in height between adjacent blocks is very close to equal all the way up the scale. Referring to the scale at the left hand side of the waveform, it's clear that each grey block is represented using something like 175 digital counts.
While this is convenient, and turns the waveform into a much more direct equivalent of a light meter, notice that the actual appearance of the image – which is, remember, a log image now being viewed on your sRGB computer display – that the greyscale does not appear linear to the eye. The difference between black and the first grey is much larger than the difference between the last grey and white. It may be easier to use a waveform monitor in this situation, but the image certainly looks rather odd if we monitor it.
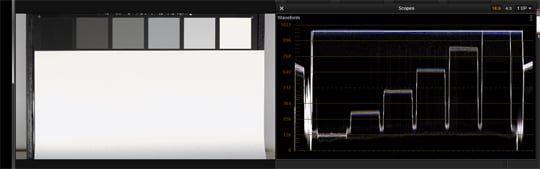
Now let's look at the same chart in 709:
From the first glance, it's clear that the waveform no longer linearly represents the brightness of the grey blocks on the chart. The brightest grey and the white are now both effectively clipped to full white, and the number of digital values used to encode the middle two blocks is now much larger – there are perhaps 300 or 325 counts between the two. Between the two darkest patches, however, there's still only maybe 150 to 175 counts. The Rec. 709 lookup table has stretched the contrast of the midtones of the image, compressing the shadow and highlight range to make room. This is of course exactly what it's designed to do, to produce an image that reasonable observers will consider to be viewable, correct, and well-exposed, although when there's an option to manually fit the extended dynamic range of the log image into a 709 viewing space, via grading, the results might be more ideal.
So, let's return to the image we started looking at, this time via a Rec. 709 LUT:
Colour is much more saturated, meaning the sky is now a richer blue as opposed to the slightly overcast-looking grey it appeared before. The dominant feature of the waveform display is still the large white peaks caused by reflections in the brushed-metal finish of the bollards, but details in the waveform are now spread out by the increase in contrast. We've undoubtedly lost detail in the very dark interior of the building, and it's arguably rather underexposed, although keeping things just like the bollards from clipping is sometimes worth a little underexposure to avoid ugly clipped highlights. The result, based on the camera's recommended exposure and Resolve's built-in 709 LUT, is not unreasonable for a late-afternoon scene in golden sunlight.
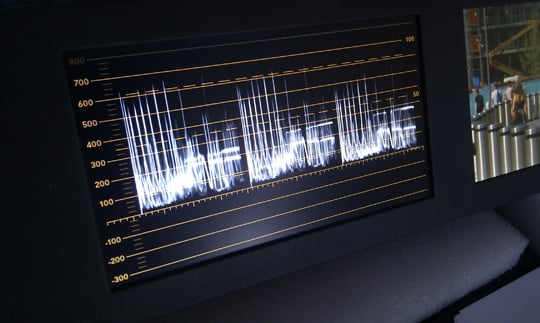
Waveform monitoring comes built into quite a few picture monitors. Blackmagic gave us one of their SmartScope Duo displays, which let you do two things at once, like this:
Using log luminance recording techniques is undoubtedly slightly more complicated than simply shooting 709 and performing minor grading tweaks on the result. The overwhelming majority of non-dramatic production simply doesn't have time to deal with this complexity either when shooting or during the grade, , and it's not really reasonable to expect most shows to take this route. It's not helpful to become a purist, as the log workflow is not for every production. Still, it's a very nice option to have.
In practical scenarios, it is often useful to have monitoring and a waveform display that can be switched back and forth between various lookup tables. The simplest approach to picture monitoring might be to have a Rec. 709 LUT on the monitor (which is what the Blackmagic Cinema Camera can do with its onboard display), so that the image looks reasonable for non-technical onlookers and so you can get an idea of the final result. A more advanced option is to create a custom LUT using something like Resolve which can be loaded into the monitor or a processing device such as an HDlink, to provide an approximation of the intended final grade. This is a useful crutch when the intention is to eventually create something extreme; it can be a bad idea to allow people watching on-set monitoring to become habituated to an image which is wildly different to your intention.
Waveform monitoring in log is in some ways conceptually simpler than doing so in Rec. 709. Open up one stop, or double up a light, or remove a one-stop ND filter, and everything on the display moves up by the same amount. Do one of those things again, and it moves up by the same amount again. There is often a need to carefully define where 18% grey is, generally by shooting a reference card, as it's easy to overlook the fact that the midtones are often no longer in the middle of the display, and the way midtones transition to shadow and highlight can be counter-intuitive for anyone used to more conventional luminance handling.
I'm intending to write a third article in our series on test and measurement which will deal with the use of waveform monitoring and vectorscopes in postproduction and grading, so watch this space.
Tags: Technology

RedShark 2020 @ All rights reserved.

Comments