7 minute read
RedShark Replay: One from the archives. Gone are the days when a light meter and a trained eye was enough; to do better, we need technological measures and test & measurement equipment.
Traditionally, digital stills cameras provide a Histogram display which indicates what proportion of the image is at various levels of brightness. While useful, a histogram is a very different – and arguably less comprehensive – way of analysing an image than the more traditional Waveform Monitor, which has its roots as a piece of test equipment used in video facilities and television studios. It provides not only a guide to brightness, but also information on the position of the subject which is at that brightness, as well as other features. Finally, the Vectorscope is a colour analysis tool which was originally intended to allow engineers to fine-tune the performance of analogue tape decks with reference to colour bars, but which may still find application both on set and in the grading suite as a means of assessing whether colours are oversaturated or poorly matched from shot to shot.
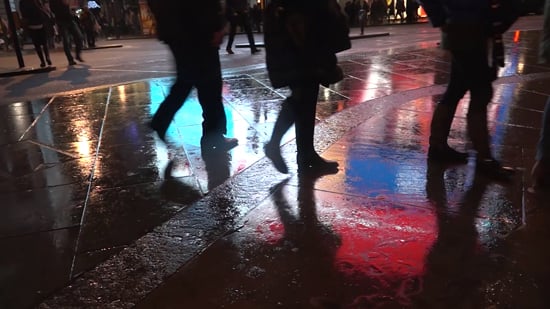
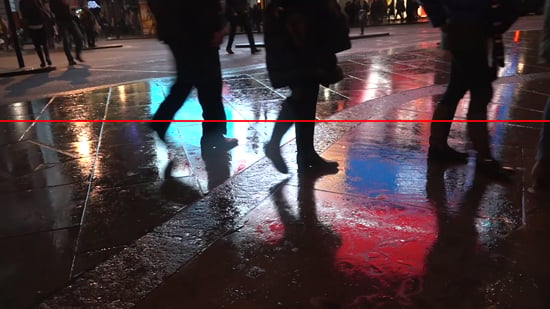
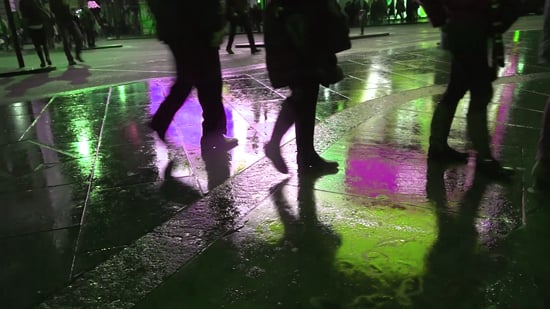
We'll use this image of a city street at night (from our NEX-EA50 review) as an example, as it has high contrast and saturated colours:
A Histogram is enticing because it exhibits a clear relationship between the brightness of the image and the configuration of the graph. Make the image brighter, and the graph moves generally to the right which reads as “more” to people used to reading written language left to right. Histograms are used to visualise all sorts of data; a graph indicating, say, the average cake slice size favoured by various age groups might also be a Histogram. A Histogram is a distribution graph, in which the horizontal axis represents luminance (or brightness) and the vertical axis represents the proportion of pixels in the image which are at that particular luminance. A brightly lit subject of a light colour might contain pixels which are mainly above 50% of maximum luminance, which will create a fuller histogram on the right hand side, toward the high-luminance end of the horizontal axis. Conversely, an image containing mainly black or low-luminance pixels will fill up the graph on the left-hand, lower-luminance end.

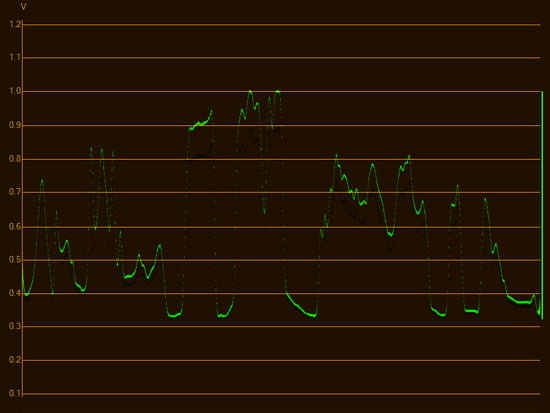
The test image as viewed on a histogram. The image is predominantly dark, so the histogram is weighted heavily to the left
We can get a more in-depth understanding of the Histogram by using synthetic test images. An image containing entirely 50% grey pixels will be represented as a single vertical line on the Histogram at the half-way point on the horizontal axis. This situation reveals one of the problems of Histograms: there is probably not enough vertical space on the graph to indicate 100% of the pixels of the image being the same luminance. Even if we decide to increase the height of the Histogram column by one pixel to represent every hundred pixels in the image which are at a given luminance, which sacrifices a lot of precision, an HD image would require a Histogram 20,736 pixels high to remove all possibility of the graph overflowing if all nearly-two-million pixels were at the same luminance (since 1920x1080÷100 = 20736) . Of course, this is not a realistic scenario for real-world photography, but it is possible to find photographic subjects that have a very limited luminance range. This can cause the top of many practical Histogram displays to be cut off, giving the impression that the luminance range is less limited than it is because we simply can't see the sharp peak on the graph.
The other problem with Histograms is that they provide no information about which part of the image is provoking a feature on the graph. Neither axis of the Histogram is related to the two axes of the photographic image. Histograms are a good, quick and easy way to get an idea of overall exposure, and an experienced eye will be able to estimate what's going on in most circumstances, but there is a better alternative.

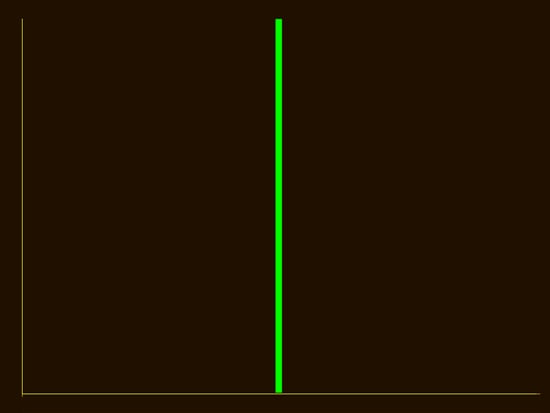
This Histogram of a completely 50% grey image consists of a single line at 50%, indicating that all of the image's pixels are at 50% luminance
The earliest Waveform Monitors were probably appropriately configured oscilloscopes, used in the development of early television. As such, their operating principle is easy to understand; in an old style cathode-ray-tube oscilloscope, as the beam moves horizontally across the display, once per video line, it is deflected vertically by the voltage of the video signal. Thus, the horizontal axis represents the horizontal axis of the image, and the vertical axis represents brightness.
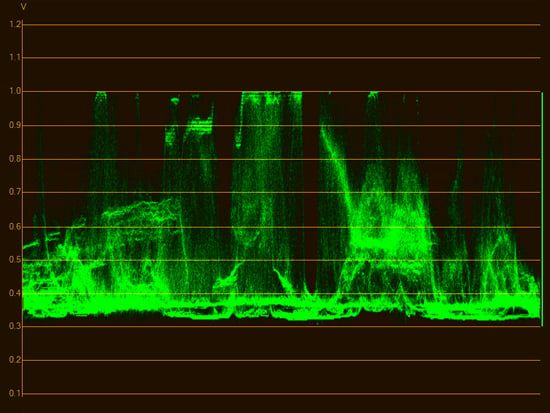
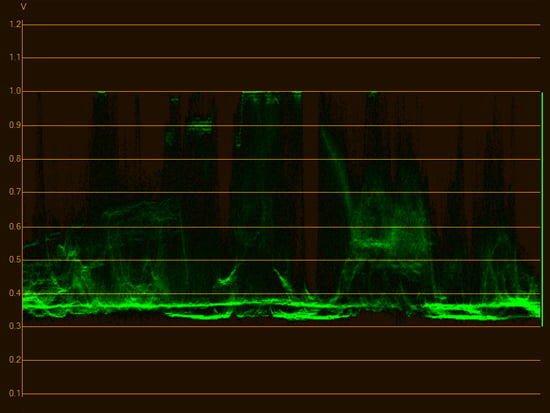
The test image as viewed on a Waveform Monitor. Notice the peaks for the bright reflected light on the wet concrete, above the shadow detail for darker parts of the image
Most Waveform Monitors are capable of reading a single row of pixels, resulting in a display of a solid, unbroken trace across the display representing the luminance of that row. More usefully for the cinematographer, a Waveform Monitor can usually provide simultaneous analysis of every line in the image, scanning and compiling all of them into the same display with variable transparency.
A single line waveform trace. Notice the trace follows the brightness of the row of pixels in the image (indicated above in red)
As a result, any point on a Waveform Display has three characteristics:
1. Horizontal position, which relates directly to the horizontal position of the column of pixels being analysed
2. Vertical position, which relates to the luminance value being analysed
3. Brightness, which represents the number of pixels at that luminance which exist within that column.
Unfortunately, this is one of those things that's easier to look at than talk about.
The Waveform Monitor provides information about the luminance of the entire image, alongside at least some information as to which subjects in the image are provoking a particular luminance feature. This is achieved by using not only the two dimensions of the histogram, but by also employing brightness as a third dimension through which to impart information.
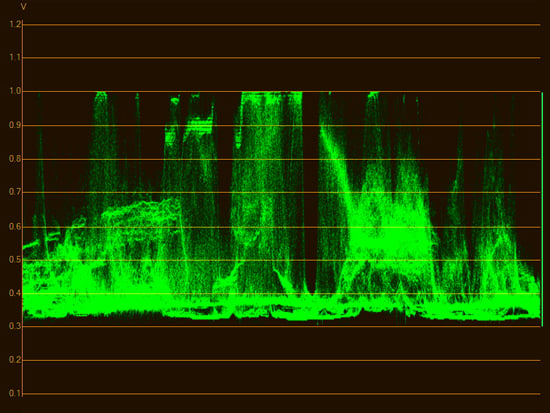
Waveform Displays at both high and low intensity allow various parts of the display to be examined in more detail
Keen observers will have noticed that a Waveform Display can potentially encounter a ranging problem similar to that suffered by a Histogram. Whereas the Histogram display can run out of vertical range when attempting to display a lot of pixels at a single luminance, a Waveform Monitor can run out of brightness range. If the output device is an 8-bit display, no more than 2 to the power of 8 (=256) levels of brightness are available. In an HD image, each horizontal position represents a column of 1080 pixels. If all 1080 of those pixels are at the same luminance, we need a brightness range on the Waveform Display of 1080 levels. In extremities, we only have a little under one-quarter the required range of 1080 pixels which could in theory be at the same brightness.
For this reason, most Waveform Monitors have a brightness or intensity adjustment which controls the amount by which the Display's intensity is increased for every pixel at a given luminance, effectively increasing or decreasing the density of the display such that a feature of interest can be clearly viewed.
A Histogram could theoretically implement a similar manually controlled vertical scaling feature to offset the problem, but I haven't seen it done.
While the Histogram and Waveform Monitor let us analyse the luminance of an image, the Vectorscope allows us to visualise the colour content. Strictly speaking, a Vectorscope is any display which visualises the relationship between two dissimilar signals as a two-dimensional X-Y graph; an audio phase plot, representing the relationship between the two audio streams in a stereo signal, is also a vector display.
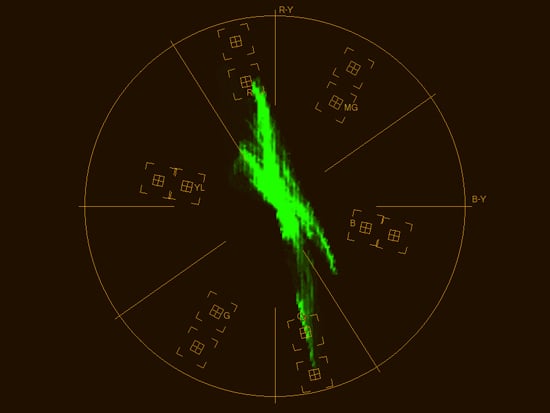
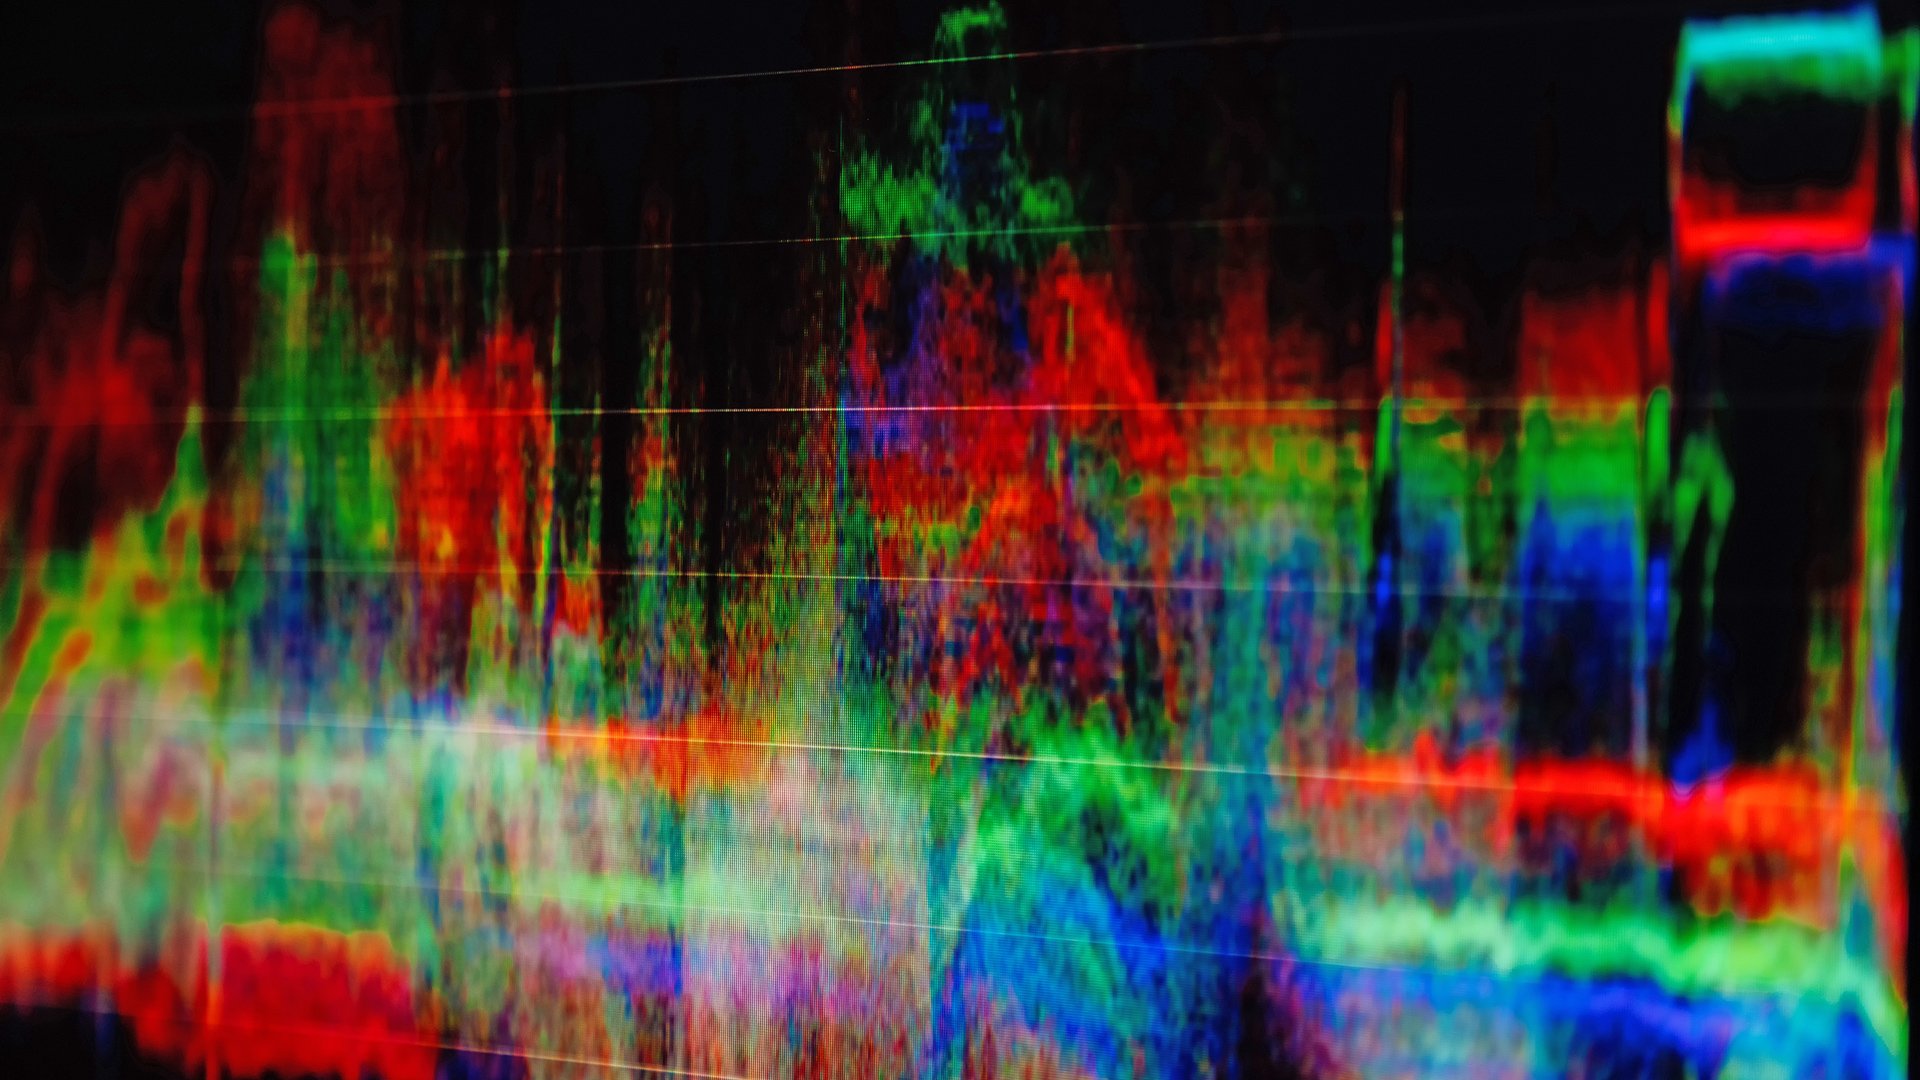
The test image as viewed on a vectorscope. Notice the peaks towards cyan and red created by the reflections
Without going into too much television engineering history, most people are aware that colour images are described by three channels – most obviously red, green and blue, but also Y, U and V, where Y represents brightness, and U and V represent the colour information. In digital systems, these channels are generally referred to as Y, Cr and Cb, where the R and B subscripts represent the fact that the two colour channels are calculated by subtracting the red and blue RGB signals from the Y luminance signal, which is, broadly, an average of R, G and B. The purpose of separating colour and brightness in this way is that the human eye detects luminance with more sharpness than it detects colour, so the two colour channels may be stored and transmitted with lower resolution without affecting perceived sharpness. This is the source of the familiar 4:2:2 and 4:1:1 notation, where colour information is sent at half or one-quarter the resolution of luminance. There are technical differences between the approaches referred to as YUV, YCrCb and the YIQ of broadcast NTSC, but for the sake of this article I'll refer to YUV, as the basic concepts are the same regardless.
The test image with hue rotated +90 degrees
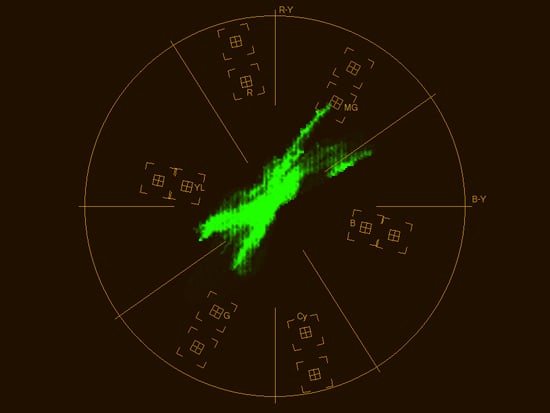
The resulting vectorscope display is literally rotated, though counterintuitively, it rotates anticlockwise for a positive hue angle alteration
A Vectorscope is, very simply, an X-Y plot of the U and V signals, the U signal vertically and the V signal horizontally, resulting in a display that's effectively a colour wheel of hues with red at or near the top. Rotating a hue control in a grading application will cause the vectorscope display to rotate. More saturated colours provoke greater deviation of the U and V signals and will be displayed toward the edges of the circular graticule of the vectorscope. Completely unsaturated colours are displayed as a single spot in the centre. Most Vectorscopes provide targets into which the dots representing the blocks of colour in a colour bar test signal should fall, which was their original purpose – to allow VTRs to be set up to display accurate colour. Digital signalling means that colour pictures are generally either guaranteed perfect or entirely absent, although there are a number of subtleties, based on the exact mathematics used to go between RGB and YUV, which could be caught with a Vectorscope and colour bars.
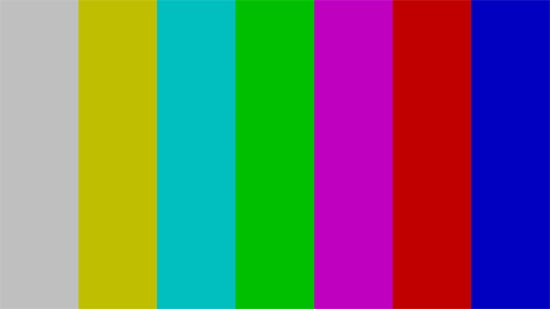
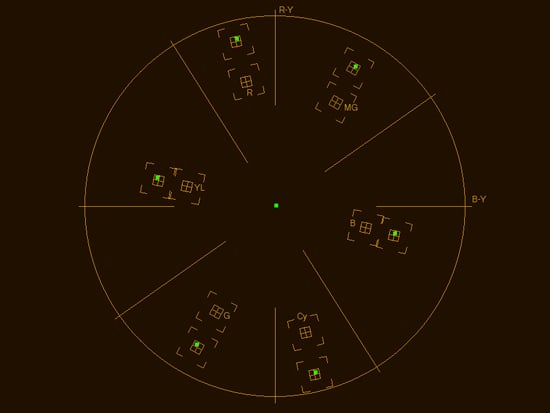
A vectorscope displaying colour bars. Notice that the highly saturated colour blocks each appear as a dot near the outside of the display, which has targets into which the test colours should fall
Apart from broadcast television, it's uncommon that a Vectorscope would be used on set by a cinematographer, but they are very relevant to colourists who may use them to accurately match colours shot to shot, and to ensure technical standards are followed. Given that the U and V signals are displayed at 90 degrees to one another, it's clear that any position within a square region can be plotted on the Vectorscope, whereas most will actually display only the central circular area. This is a reference to the earliest days of colour television and the use of a signalling technique called quadrature amplitude modulation to graft colour onto black-and-white television while maintaining backward compatibility; the colour gamut was limited, broadly speaking, to the central circle of hues. Anything falling outside the circle – and often, things falling near its edge – may be colours that tape decks, transmitters and televisions can't handle.
DSLRs often provide only a Histogram, although other features are becoming more common on some quite affordable monitors. Broadcast and news-gathering cameras have long included features such as zebra stripes, which draw a pattern over areas of the image above a selected luminance, which can provide a guide to exposure as well as a warning of ugly clipping. More advanced Waveform Monitors and Histograms may provide individual displays for red, green and blue channels, providing even more information and making certain grading operations easier. Ultimately, proper selection and use of test and measurement equipment may not only help to diagnose problems, but can make for easier, more consistent shooting and less reliance on grading to solve problems.
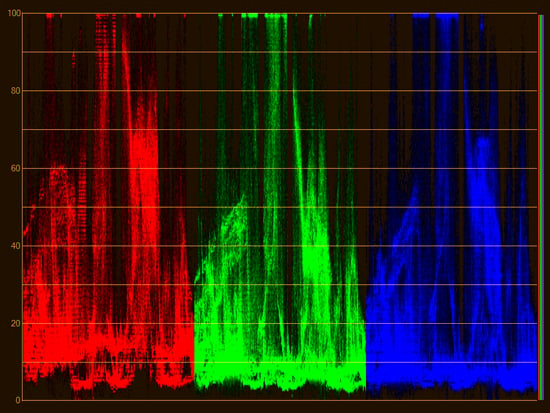
The “RGB Parade” is a waveform display with a separate trace for each of the red, green and blue channels
Tags: Production

RedShark 2020 @ All rights reserved.

Comments