4 minute read
 Sekonic C700 Spectrometer
Phil Rhodes reviews the Sekonic C700, which won't replace your exposure meter, but will provide valuable information on the CRI and colour spectrum emitting from your light sources.
In the past, we've talked a lot about the colour quality of light. While it's far from a new field, there's increasing need for its practical application. This is true given the great interest in new technologies – principally the huge variety of LED that now exists, but also things like the new electrode-less plasma lights popularised by Hive Lighting and CDM discharge sources built for other industries yet applied quite successfully by companies like Cool Lights. Even HMIs change colour as they age. Most manufacturers will provide spectral output charts for their products on demand (we should be very suspicious of those who won't), but even then there's no end to the sort of practical lighting one might encounter on location and perhaps need to select filters to correct or find other lights that match.
Doing this by eye is a dicey prospect. Human beings (even colourists who might claim otherwise) are not very good at truly objective consistency in this regard. Cameras have quirks that the eye might not see even under ideal circumstances. There have been solutions to this for a while. Any light can be characterised in terms of its colour quality in a laboratory, but pocket instruments are an innovation of the last year or so.
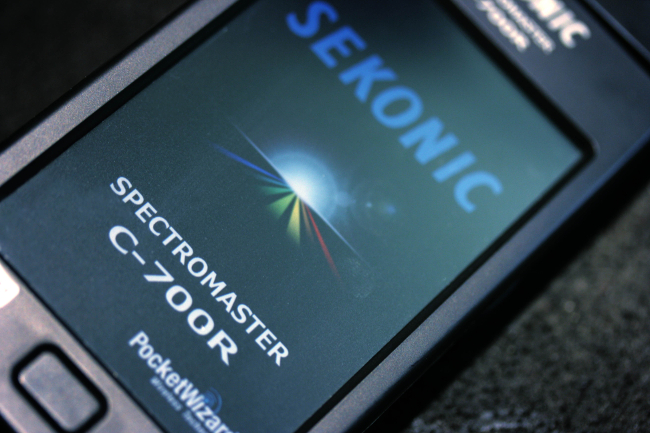
One of the more recent is Sekonic's C700, of which the company started showing prototypes at the end of 2014. It may help that the C700 is manufactured by a name familiar to anyone who's ever been in the market for an exposure meter. The C700 is clearly aimed squarely at the photographic, film and television markets. The R suffix, for the record, indicates radio remote flash triggering capability, which won't be of much interest to motion picture camera people, but naturally has application for stills photographers.
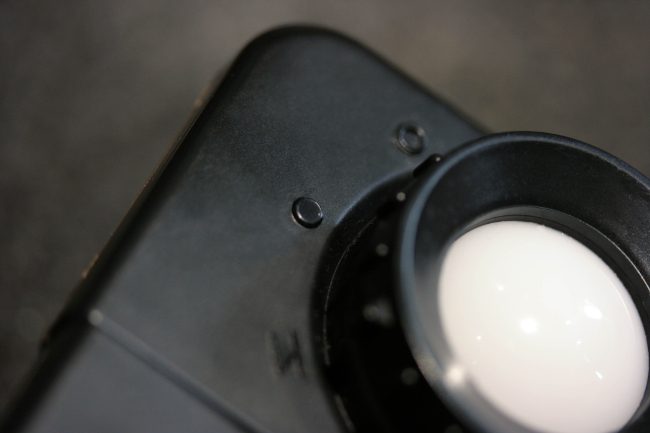
At about £1300, the C700 is considerably cheaper than UPRTek's MK350S, but broadly price-comparable with the simpler MK350D. The -D suffix nonetheless offers crucial CRI evaluation. Spectrometers are also available from Gossen and Gamma Scientific, but as far as I know none of these meters offers TLCI measurement, an issue we'll examine in more detail later. Operationally, the meter runs from a pair of AA cells and behaves much like a conventional exposure meter, although it takes several seconds to read dim light sources. There's a short delay after switch-on for black level calibration, during which the measurement bulb housing must be manually rotated to engage a shutter.
Thereafter, a measurement can be started simply by pressing a button and is viewable by default as a display showing the correlated colour temperature, deviation from the Kelvin line, colour rendering index (the average Ra, for purists) and as a spectral distribution graph. Up to 99 readings can be stored and up to four compared. Although the meter will read out the illumination in lux, there is no conventional exposure meter function.
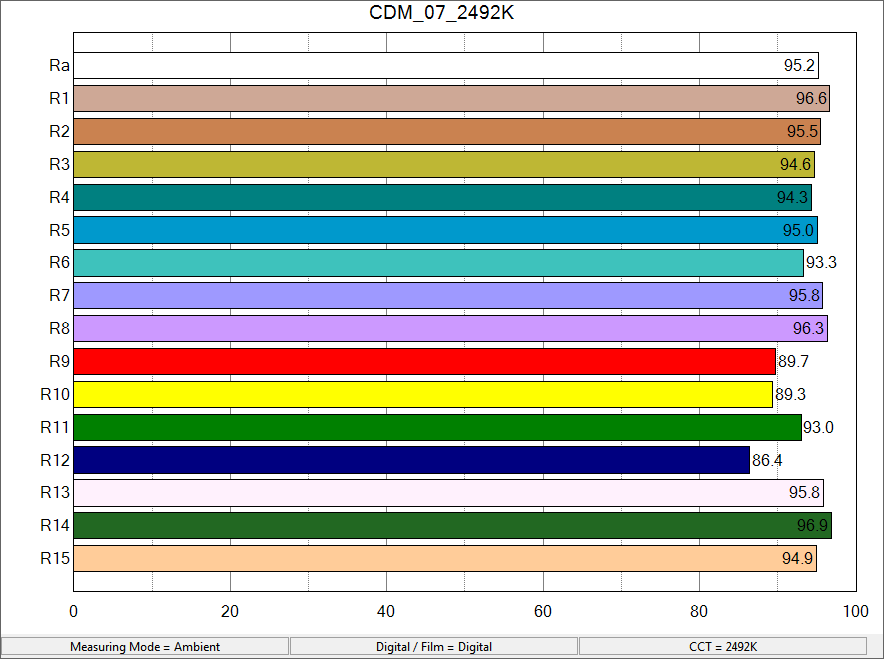
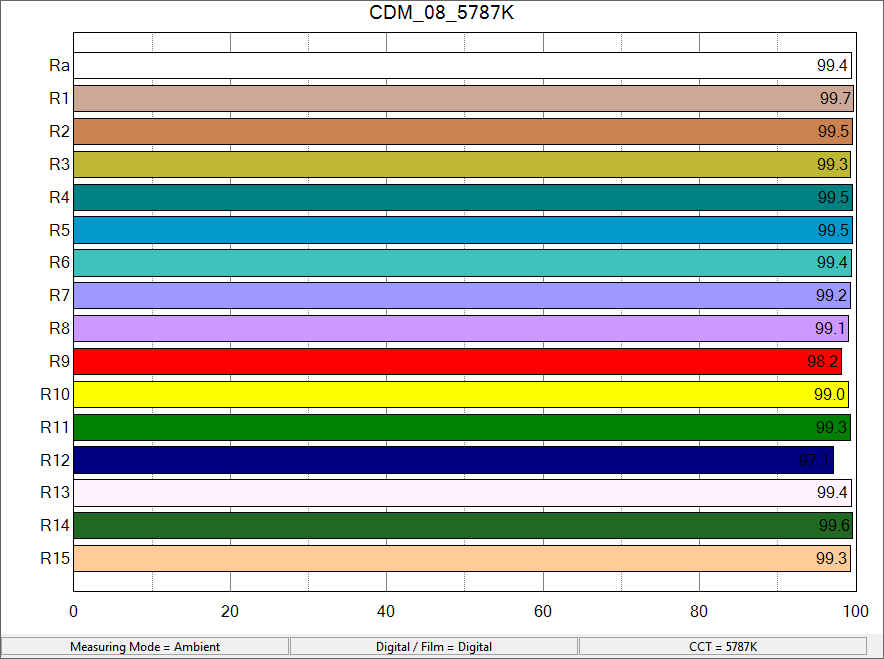
So far, so straightforward and it's certainly entertaining to measure some well-known light sources to see how they measure up. The well-known blue peak of LED sources is clearly visible, tungsten-halogen lighting is very heavy in the red and an afternoon sun measured as a surprisingly lumpy spectrum with a colour temperature of 5047K and a CRI of 99.5. Many LEDs intended for domestic lighting measure in the mid-70s, which isn't something we'd necessarily want to use for film and TV work. The device correctly refuses to calculate a CRI for highly saturated light sources, such as coloured LEDs, and produces nice example graphs showing just how monochromatic a red LED really is. The CRI detail display is particularly enlightening, presenting a comparative graph showing the success with which the light source under test would illuminate each of the CRI test patches.
 CRI Chart of Overcast Daylight - Click for Larger View
CRI Chart of Tungsten Desk Lamp - Click for Larger View
Since the average (hence the “a” in Ra) only includes fairly unsaturated test patches, there's far more information in this complete graph than a single number, going so far as to make it clear which colours risk causing problems and to what degree. It's notoriously possible for light sources to score high on CRI while still harbouring serious problems and this may go some way toward ameliorating that issue.
Measurements can be stored and recalled. Stored measurements can be downloaded from the device to a computer over USB. The manual doesn't describe exactly how the fundamental spectral measurement is performed by the device, but it clearly isn't a sampling monochromator, which would require a bulky, servo-actuated opto-mechanical assembly involving a prism and articulated mirror. Still, documentation suggests that the C700 measures intensity at one-nanometre increments,
implying a healthy four hundred data points to fill the spectral graph between its 380 and 780nm extremities.
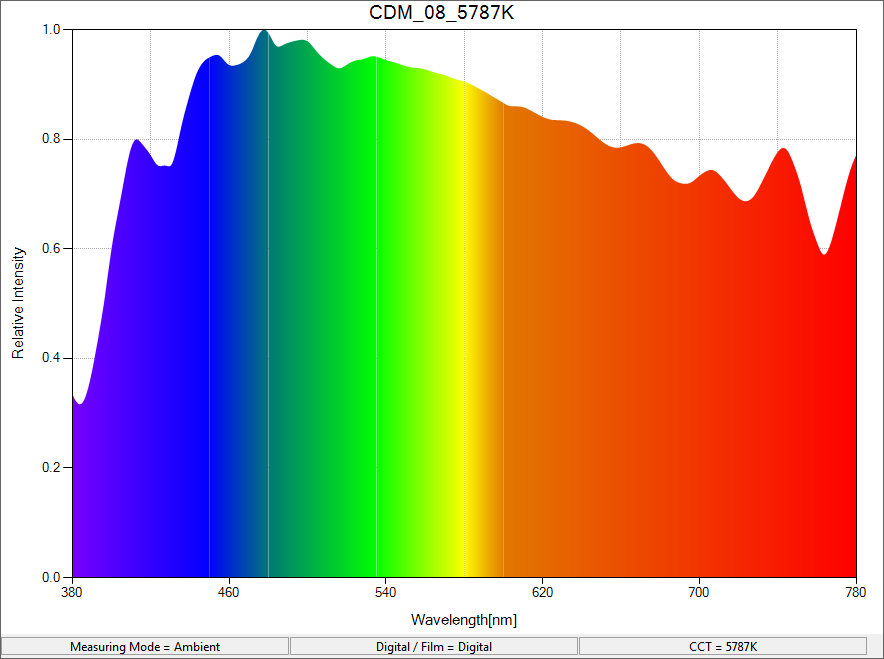 Spectrum of Overcast Daylight - Click for Larger View
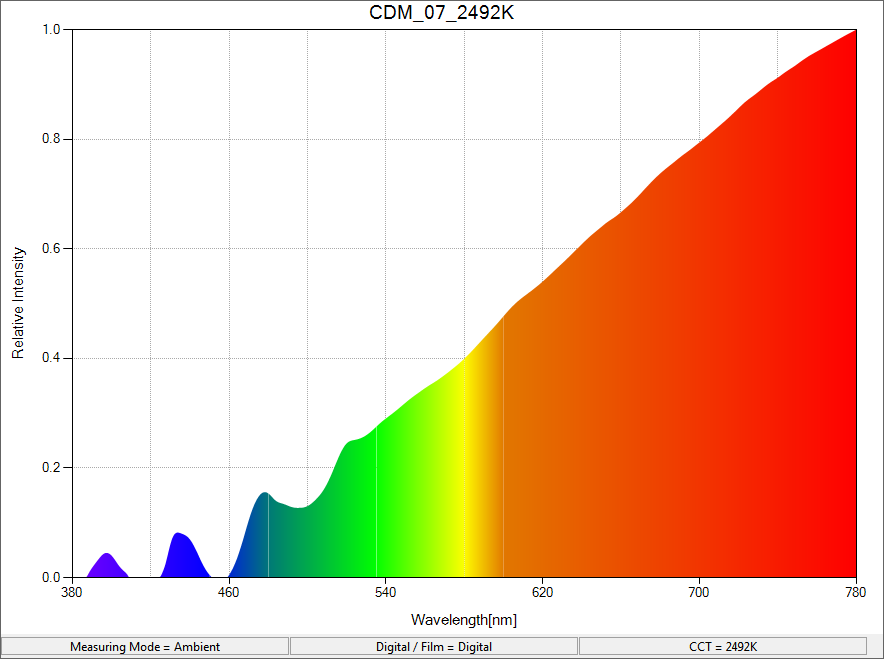 Spectrum of Tungsten Desk Lamp - Click for Larger View
One quirk is that there is no way to access this raw numeric data. Images depicting various data sets are available (several accompany this article), but there isn't a way to get a list of numbers representing relative intensity at all the sampled wavelengths. This is a shame because it would have otherwise been possible to feed the information into a TLCI calculation, which is something the C700 won't do internally. Perhaps future firmware and driver updates can address both of these issues.
A trickier problem is that the C700 uses a resistive touchscreen display, which feels very much like yesterday's technology. This display can be rather uncooperative, especially in circumstances such as typing in names for stored readings. This involves a telephone-style alphabetic keypad of the variety wherein typing a “C” requires cycling through A and B on the number 1 button.
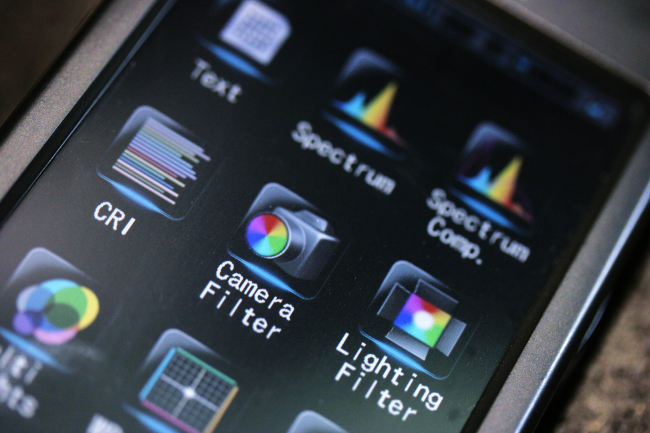
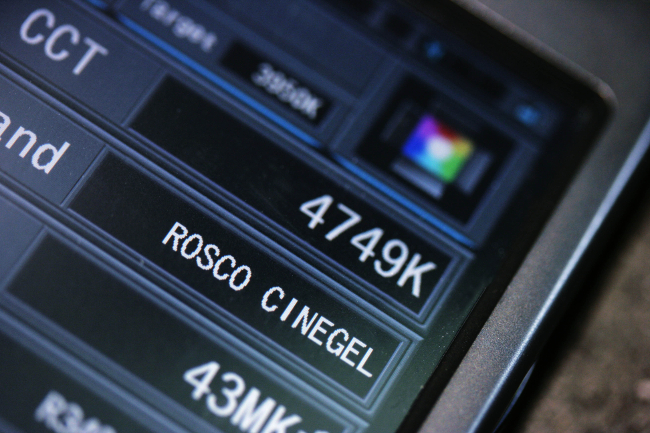
The combination of an iffy touchscreen and a slightly primitive approach to UI in the firmware is a bit of a let-down at a price point aimed so squarely at the professional market. Other features seem complete, though, and include the ability to recommend colour correction camera filters from the Wratten/Lee or Fujifilm ranges, as well as Lee and two types of Rosco lighting filter.
Overall, the performance of the C700 purely as a spectrometer (as opposed to a beautiful expression of user-oriented embedded systems design) is something that the world badly needs. One might almost yearn for the days where tungsten-halogen was an advanced technology and everything was shot under either tungsten light or that produced by the local star, but things could hardly be more different now. The need for pocket spectrometry is a direct consequence of the drive for low-energy lighting, which is itself a consequence of compressed budgets and schedules and an increased need to work quickly, with battery-powered lights, and without access to a generator or mains electricity. LEDs are improving, but for the moment it remains important to watch them improve, in terms of both colour temperature and the quality of the white light they emit.
Quirks notwithstanding, the Sekonic C700 is one of those things which immediately seems like a high-end refinement, but which actually becomes more important at the lower end of film and TV work, where reliance on the less-the-ideal is a daily occurrence.
Tags: Production

RedShark 2020 @ All rights reserved.

Comments