 BBC election graphics
The BBC have put online a simple little video explaining how their election graphics work, or sometimes don't
We've just had some local elections here in the UK and so the Election graphics system has been dusted off and brought back up to speed.
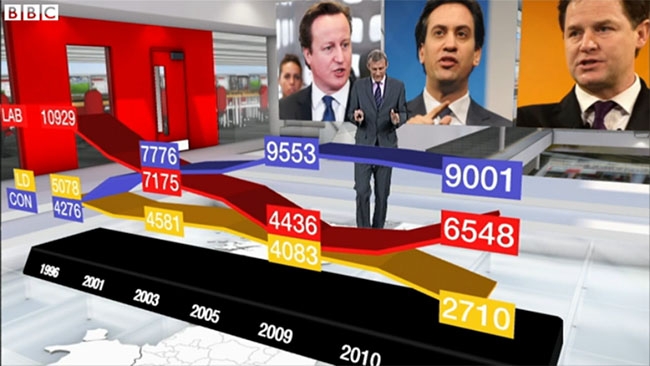
There have been some considerable changes in how graphics are presented to the audience during something like an election, where data is continually being updated and everything has to happen in real time. In the early days the BBC famously used it's "Swingometer" as seen here:

Now they use a combination of a chroma key studio, 3D camera tracking and a real time 3D graphics system to illustrate the data in a simple and effective way.
You can see the report here
Tags: Technology


Comments